This is affecting our production applications.
The issues do not seem to be reported here https://status.squidex.io/
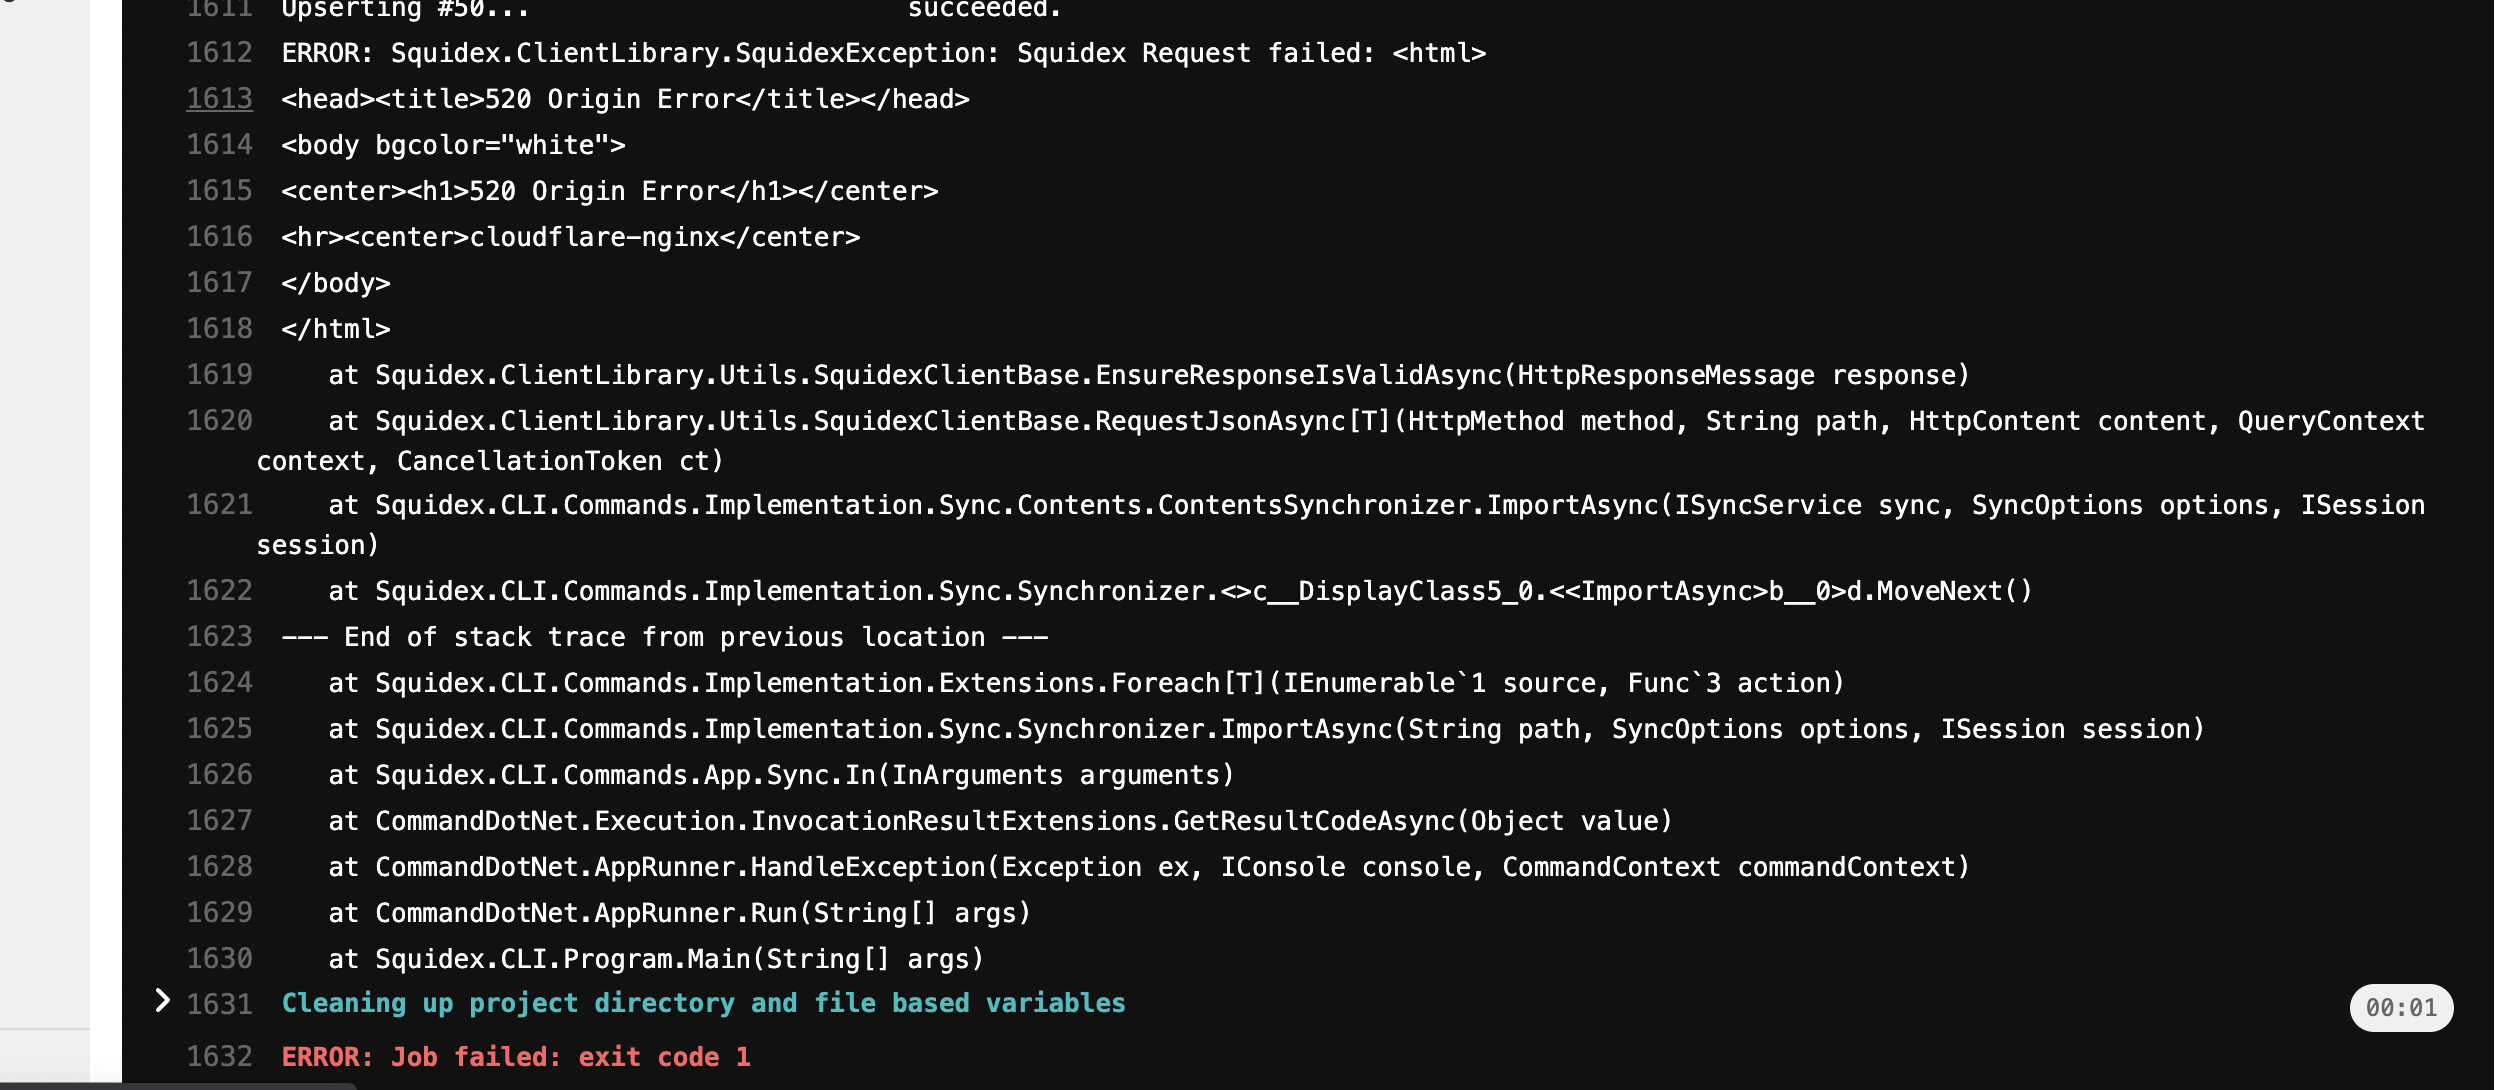
Error seems to be intermittent however it usually lasts for about 10-15 minutes and can be replicated across different regions (and can be replicated locally - see screenshot, FYI the url is https://cloud.squidex.io/)
I have…
[ ] Checked the logs and have uploaded a log file and provided a link because I found something suspicious there. Please do not post the log file in the topic because very often something important is missing.
I’m submitting a…
[ ] Regression (a behavior that stopped working in a new release)
We are also improving our Sentry logging. Is there anything we should include when Squidex throws an error that will help you trace your side? We intend to log graphql queries and the response returned should an error be thrown
What exactly does it mean that you do not see it in the logs?
You do not have the metrics for DB and external services response times?
Memory/CPU usage for internal infrastructure?
This does not look like memory deallocation or tree-shaking problem if this is not on a single application server.
Look at network changes that occurred on your infrastructure.
Maybe the cloud/servers provider made some changes that caused DB/API services to be no longer available.
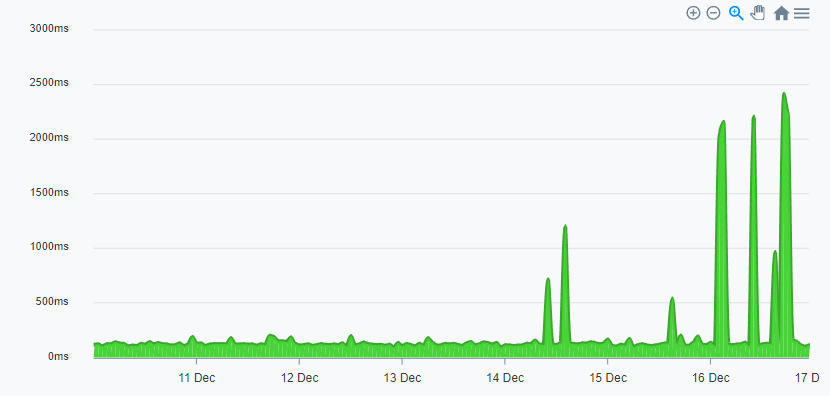
I have an up time check in Google cloud that monitors Squidex cloud from four locations and except the short issue it does not report anything. This correlates with the internal logs from the application (first screenshot).
I can also reach Squidex just fine.
However I see some downgrade in performance but not exactly where it is coming from.
The issue is no longer happening for our application and these pages work. I do wonder if while your backend responds perhaps there is a proxy layer above it times out and thus sends no response which gives us the error on cloudflare. I briefly looked at cloudflare timeouts and found them to be quite long.
I would like to suggest an enhancement for errors. I don’t think Squidex should ever be returning an HTML Cloudflare page when there is a problem with the API. Rather a message within your own infrastructure in all cases (so that they can be logged)
Good point, cloudflare should not return HTML. The timeout issues are recorded though in the logs, because the request is aborted by cloudflare and then tracked.
It also be good to track all errors (even valid ones). I have used to use things like https://www.stathat.com/ to alert us if there was a sudden spike in requests resulting in an error. Sometimes its a rouge import script or some hacker trying a bunch of things but its also helped detect allot more insidious smaller scale issues.
The always online feature serves a cached version of the page, which does not make sense anyway and should bettet bubble up the 521 to the client. Perhaps I can test that with a demo project very early next year.
But I am not aware that there are any logs in cloudflare, have to test that. Internally squidex uses Google Stackdriver, error reporting and monitoring, but I can not expose that. To be honest I am not 100% sure what your expectations are.