I’m submitting a…
- [ ] Regression (a behavior that stopped working in a new release)
- [ ] Bug report
- [ ] Performance issue
- [ X] Documentation issue or request
Current behavior
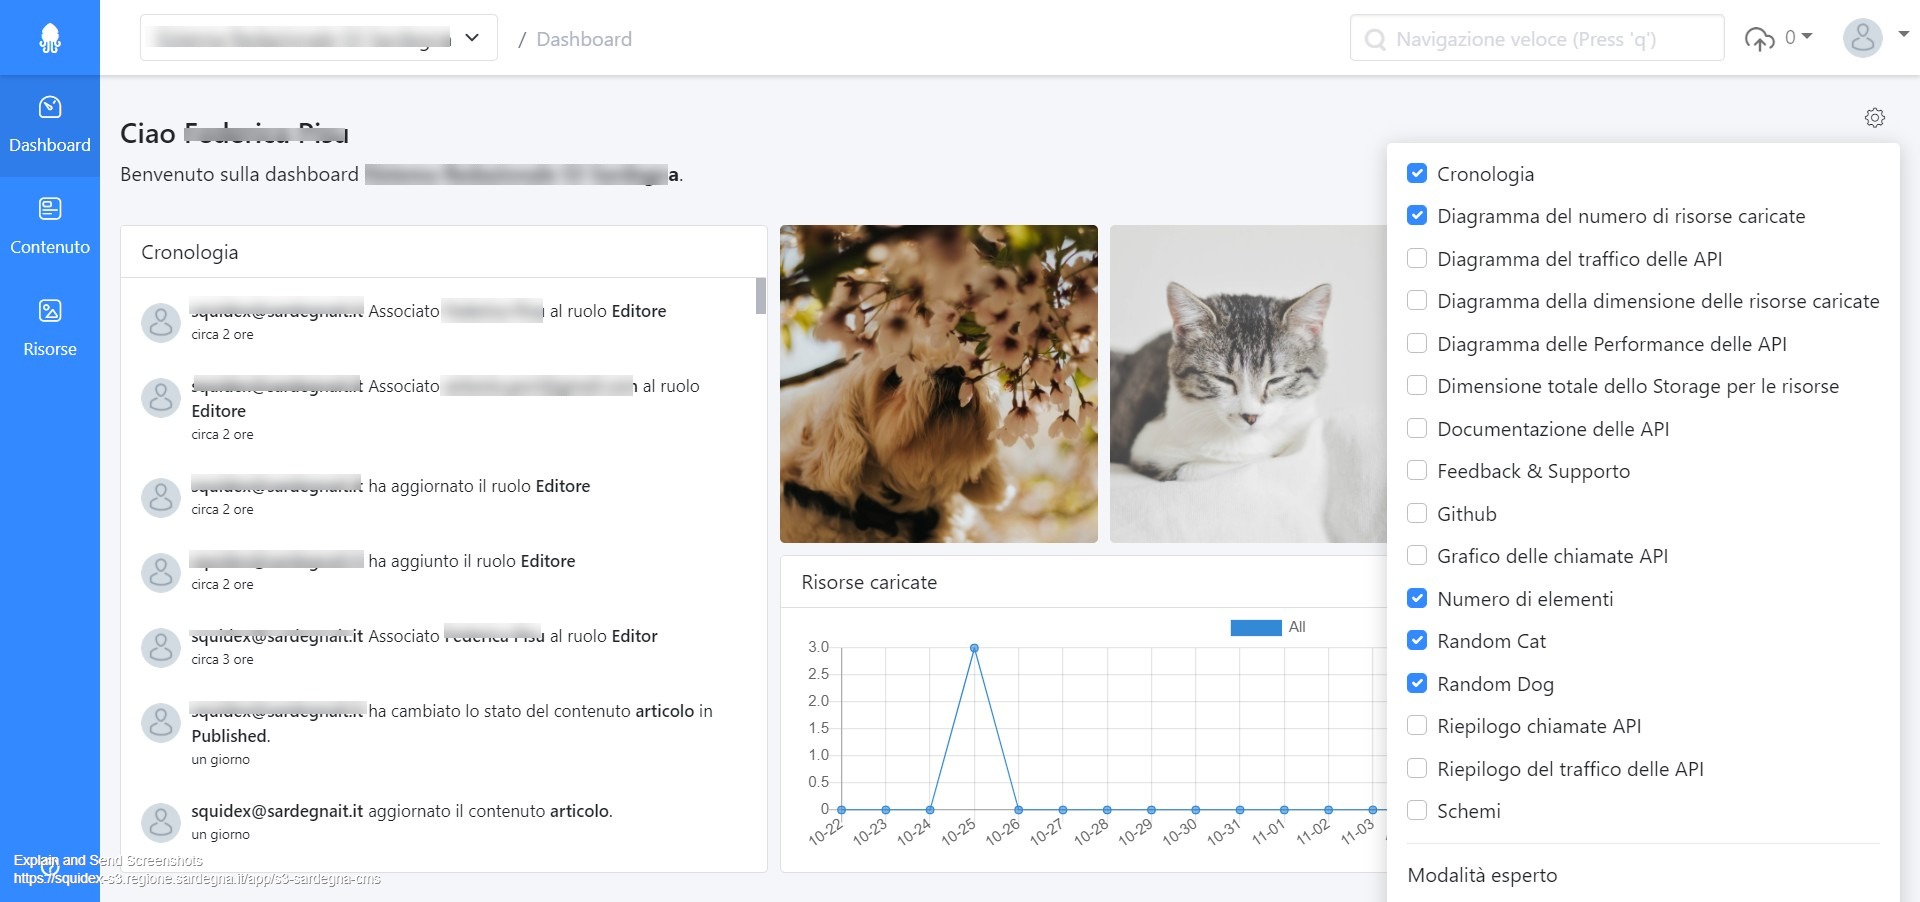
I have config my dashboard (select panel I want see) and press update button, but when I change the screen (for example I select content link) and after go to dashboard the configuration disappeared.
What am I do wrong?
Is it possibile configure a default dahboard based on role?
I created a custom role with only permission on contents and assets but on the dashboard it can see github, api panel and schema.
thanks in advance,
Federica
Environment
- [X ] Self hosted with docker
- [ ] Self hosted with IIS
- [ ] Self hosted with other version
- [ ] Cloud version
Version: [5.9]
Browser:
- [X ] Chrome (desktop)
- [ ] Chrome (Android)
- [ ] Chrome (iOS)
- [ ] Firefox
- [ ] Safari (desktop)
- [ ] Safari (iOS)
- [ ] IE
- [ ] Edge
Others: