I have…
- [ x] Read the following guideline: https://docs.squidex.io/01-getting-started/installation/troubleshooting-and-support. I understand that my support request might get deleted if I do not follow the guideline.
I’m submitting a…
- [ ] Regression (a behavior that stopped working in a new release)
- [ ] Bug report
- [ x] Performance issue
- [ ] Documentation issue or request
Current behavior
I am trying to get data from Squidex using Squidex Client Library. It is taking more than 1.5 seconds to get the data. Below is the the data from mongodb profiler.
{
    op: 'query',
    ns: 'SquidexContent.States_Contents_Published3',
    command: {
      find: 'States_Contents_Published3',
      filter: {
        _si: { '$in': [ '5e2d6876-ff0f-49c3-9a74-340545e7daba' ] },
        'do.SectionId.iv': 121281
      },
      limit: 20,
      returnKey: false,
      showRecordId: false,
      '$db': 'SquidexContent'
    },
    keysExamined: 702501,
    docsExamined: 702501,
    cursorExhausted: true,
    numYield: 5544,
    nreturned: 6,
    locks: {
      Global: { acquireCount: { r: Long("5547") } },
      Database: { acquireCount: { r: Long("5545") } },
      Collection: { acquireCount: { r: Long("5545") } }
    },
    storage: {
      data: {
        bytesRead: Long("164242947"),
        timeReadingMicros: Long("652784")
      }
    },
    responseLength: 5542,
    protocol: 'op_query',
    millis: 2615,
    planSummary: 'IXSCAN { _si: 1, dl: 1, mt: -1 }',
    execStats: {
      stage: 'LIMIT',
      nReturned: 6,
      executionTimeMillisEstimate: 2465,
      works: 702502,
      advanced: 6,
      needTime: 702495,
      needYield: 0,
      saveState: 5544,
      restoreState: 5544,
      isEOF: 1,
      invalidates: 0,
      limitAmount: 20,
      inputStage: {
        stage: 'FETCH',
        filter: { 'do.SectionId.iv': { '$eq': 121281 } },
        nReturned: 6,
        executionTimeMillisEstimate: 2445,
        works: 702502,
        advanced: 6,
        needTime: 702495,
        needYield: 0,
        saveState: 5544,
        restoreState: 5544,
        isEOF: 1,
        invalidates: 0,
        docsExamined: 702501,
        alreadyHasObj: 0,
        inputStage: {
          stage: 'IXSCAN',
          nReturned: 702501,
          executionTimeMillisEstimate: 597,
          works: 702502,
          advanced: 702501,
          needTime: 0,
          needYield: 0,
          saveState: 5544,
          restoreState: 5544,
          isEOF: 1,
          invalidates: 0,
          keyPattern: { _si: 1, dl: 1, mt: -1 },
          indexName: '_si_1_dl_1_mt_-1',
          isMultiKey: false,
          multiKeyPaths: { _si: [], dl: [], mt: [] },
          isUnique: false,
          isSparse: false,
          isPartial: false,
          indexVersion: 2,
          direction: 'forward',
          indexBounds: {
            _si: [
              '["5e2d6876-ff0f-49c3-9a74-340545e7daba", "5e2d6876-ff0f-49c3-9a74-340545e7daba"]'
            ],
            dl: [ '[MinKey, MaxKey]' ],
            mt: [ '[MaxKey, MinKey]' ]
          },
          keysExamined: 702501,
          seeks: 1,
          dupsTested: 0,
          dupsDropped: 0,
          seenInvalidated: 0
        }
      }
    },
    ts: ISODate("2022-11-10T12:51:29.899Z"),
    client: '127.0.0.1',
    allUsers: [],
    user: ''
  }
It is returning 3 records.
Below is the screenshot schema of Squidex
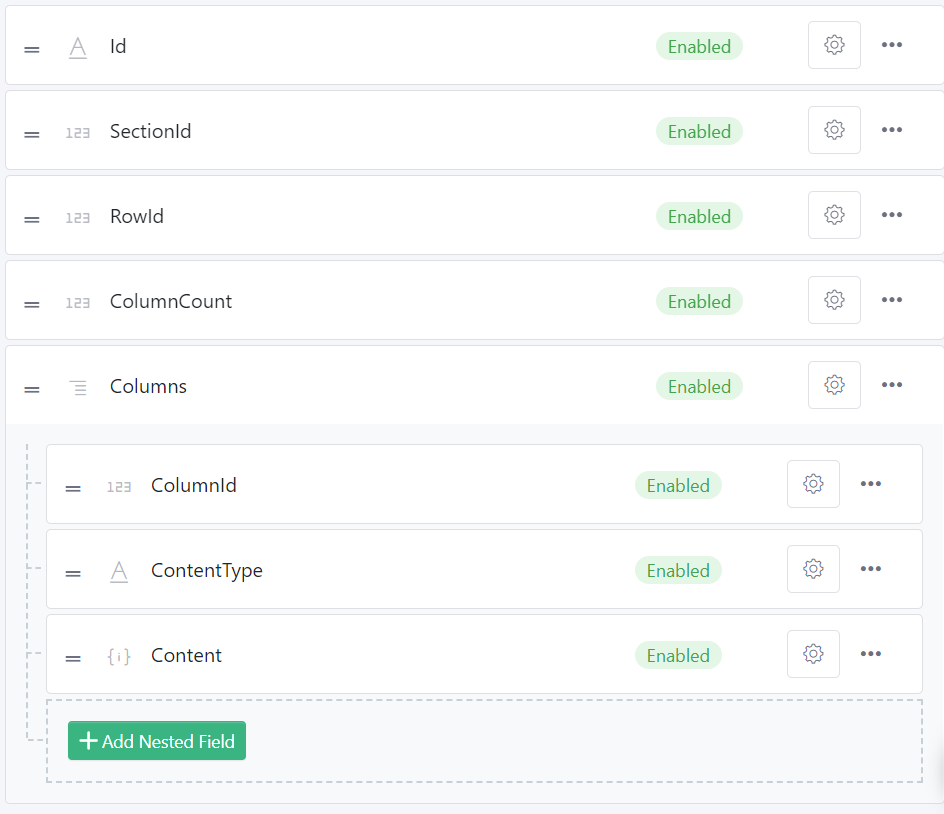
I am filtering the data on “SectionId”. Please let me know if I have to add index to that field, if yes then please help to index the field from Squidex.
Else please propose a solution.
Expected behavior
It should take less than a second to get the data
Minimal reproduction of the problem
Environment
App Name:
- [ ] Self hosted with docker
- [ x] Self hosted with IIS
- [ ] Self hosted with other version
- [ ] Cloud version
Squidex Version: 6.7.0
MongoDB Version: 4.0.10 Community
Squidex.ClientLibrary Version: 8.21.0
VM Configuration: 2 Core 4GB RAM
MongoDb is also on the same server.
Please let me know if other details are required.