[ ] Regression (a behavior that stopped working in a new release)
[ ] Bug report
[X] Performance issue
[ ] Documentation issue or request
Current behavior
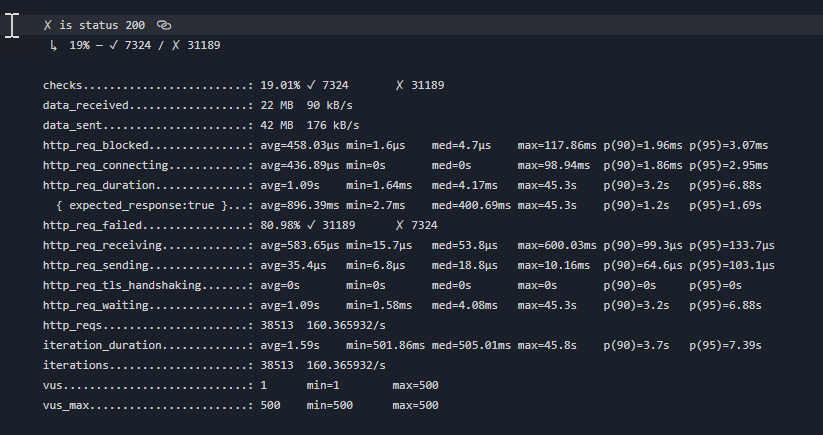
I deployed squidex 7 helm chart by using AKS cluster cloud and used MongoDB bitnami helm chart version: 13.0.1 . It is running, but when testing the efficiency of performance using k6, it gives very poor results and squidex deployment and pod is crashed.
Expected behavior
Works well or high efficiency even in case of increased load
Minimal reproduction of the problem
Environment
App Name:
[ X ] Self hosted with Kubernetes
[ ] Self hosted with IIS
[ ] Self hosted with other version
[ ] Cloud version
Version: [squidex 7.0.2]
Browser:
[ X ] Chrome (desktop)
[ ] Chrome (Android)
[ ] Chrome (iOS)
[ ] Firefox
[ ] Safari (desktop)
[ ] Safari (iOS)
[ ] IE
[ ] Edge
Others:
Is it possible to best explain the architecture in which Squidex works?
What is the maximum and minimum load?
How long does it take the one request in the normal situation?
I have no idea what to answer here. I don’t know any details how you have configured the cluster and the deployment. I have not run k6 since a while because I do not have performance issues with the cloud, but I recommend not to run k6 in the same cluster. k6 is a great tool but very resource hungry. When I tested it locally 80% of the local CPU was consumed by k6 and not Squidex.
I used the Squidex as multi tenant. so I need measure the efficiency. Do you think the resource( cpu and memory) in helm chart it is enough for this case?
Do you think if I use another tool, am I likely to have the same issue?
Does [quote=“asayel_alsulami, post:10, topic:4579”]
I used the Squidex as multi tenant. so I need measure the efficiency. Do you think the resource( cpu and memory) in helm chart it is enough for this case?
[/quote]
250m CPU means 25% of a one Virtual Core, like 12.5% of a normal core. That’s not a lot. 500MB could be enough for your use case, but not for real production. I would at least assign 3 GB
 … thank you.