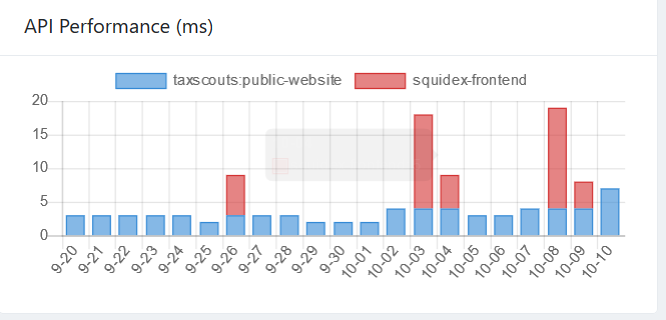
Hi we’re finding performance very slow this morning, so slow it’s setting off our “squidex down” alerts.
However doens’t seem to be showig anything on our dashboard.
Has anythng happened overnight?

Hi we’re finding performance very slow this morning, so slow it’s setting off our “squidex down” alerts.
However doens’t seem to be showig anything on our dashboard.
Has anythng happened overnight?

Hi, the charts do only show internal performance. No network latency and so on. What do you mean with “Very slow”?
Yeah we are getting the same issue to with 522 status (connection timed out) - lots of them during our sync process
Well our azure alerts have been tripping out which happens at 30 seconds load time.
Thats load time for our page (which makes multiple squidex api calls) but still…
I restarted the cluster, please tell me if the issue is fixed. One of the nodes was not in the cluster anymore but still in the load balancer.
Seems to have resolved it now - thanks Sebastian 
Yes seems much better now. Cheers