MongoDB: Slow query #2

I have…

I’m submitting a…

  • [ ] Regression (a behavior that stopped working in a new release)
  • [ ] Bug report (?)
  • [x] Performance issue (?)
  • [ ] Documentation issue or request

Current behavior

As the last bug report is already closed and it seems it is most likely solved, we now run on last version for few days and after checking log from mongo it seems it still have bunch of “slow query”.

{
  "command": {
    "$db": "Squidex",
    "filter": {
      "_ai": "2a88849e-4582-4606-83bc-52102cbd6544",
      "dl": {
        "$ne": true
      },
      "id": {
        "$ne": "00000000-0000-0000-0000-000000000000"
      },
      "mt": {
        "$ne": {
          "$date": "1970-01-01T00:00:00.000Z"
        }
      }
    },
    "find": "States_Assets2",
    "limit": 100,
    "lsid": {
      "id": {
        "$uuid": "c2cc8c27-7c49-477c-a228-c86e769b3092"
      }
    },
    "skip": 13600,
    "sort": {
      "id": 1,
      "mt": -1
    }
  },
  "cursorExhausted": true,
  "docsExamined": 100,
  "durationMillis": 160,
  "keysExamined": 77268,
  "locks": {
    "FeatureCompatibilityVersion": {
      "acquireCount": {
        "r": 78
      }
    },
    "Global": {
      "acquireCount": {
        "r": 78
      }
    },
    "Mutex": {
      "acquireCount": {
        "r": 1
      }
    }
  },
  "nreturned": 100,
  "ns": "Squidex.States_Assets2",
  "numYields": 77,
  "planCacheKey": "60B1945E",
  "planSummary": "IXSCAN { mt: -1, id: 1, _ai: 1, dl: 1, pi: 1, td: 1 }",
  "protocol": "op_msg",
  "queryFramework": "classic",
  "queryHash": "52935024",
  "remote": "10.0.28.4:55000",
  "reslen": 80947,
  "storage": {},
  "type": "command"
}

and this:

{
  "command": {
    "$db": "SquidexContent",
    "aggregate": "States_Contents_Published3",
    "cursor": {},
    "lsid": {
      "id": {
        "$uuid": "3bf610e2-1b62-4116-8e5f-3cc82b7b70d7"
      }
    },
    "pipeline": [
      {
        "$match": {
          "_ai": "2a88849e-4582-4606-83bc-52102cbd6544",
          "_si": {
            "$in": [
              "366cf366-a894-4b4e-8c69-723f87f85a34"
            ]
          },
          "dl": {
            "$ne": true
          },
          "id": {
            "$gt": "00000000-0000-0000-0000-000000000000"
          },
          "mt": {
            "$gt": {
              "$date": "1970-01-01T00:00:00.000Z"
            }
          }
        }
      },
      {
        "$project": {
          "_id": 1,
          "ct": 1,
          "id": 1
        }
      },
      {
        "$sort": {
          "ct": -1,
          "id": 1
        }
      },
      {
        "$skip": 1300
      },
      {
        "$limit": 100
      },
      {
        "$lookup": {
          "as": "Joined",
          "from": "States_Contents_Published3",
          "let": {
            "id": "$_id"
          },
          "pipeline": [
            {
              "$match": {
                "$expr": {
                  "$eq": [
                    "$_id",
                    "$$id"
                  ]
                }
              }
            },
            {
              "$project": {
                "dd": 0
              }
            }
          ]
        }
      },
      {
        "$project": {
          "Joined": 1
        }
      }
    ]
  },
  "cursorExhausted": true,
  "docsExamined": 2409,
  "durationMillis": 192,
  "hasSortStage": true,
  "keysExamined": 2410,
  "locks": {
    "FeatureCompatibilityVersion": {
      "acquireCount": {
        "r": 207
      }
    },
    "Global": {
      "acquireCount": {
        "r": 207
      }
    },
    "Mutex": {
      "acquireCount": {
        "r": 202
      }
    }
  },
  "nreturned": 100,
  "ns": "SquidexContent.States_Contents_Published3",
  "numYields": 5,
  "planCacheKey": "1643EE5E",
  "planSummary": "IXSCAN { _si: 1, dl: 1, mt: -1 }",
  "protocol": "op_msg",
  "queryFramework": "classic",
  "queryHash": "518D9E69",
  "remote": "10.0.28.4:57628",
  "reslen": 897299,
  "storage": {},
  "type": "command"
}

Both of this “slow” query seems to be common:

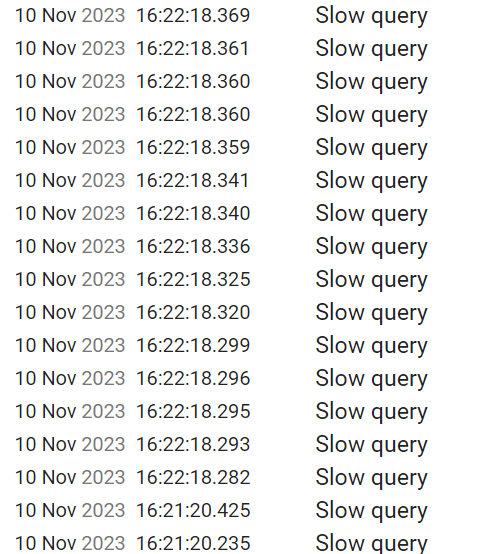
It may be normal. I’m not sure if I notice any real (performance) impact as the last change already reduced mongo load significantly.

Environment

  • [x] Self hosted with docker
  • [ ] Self hosted with IIS
  • [ ] Self hosted with other version
  • [ ] Cloud version

Version: 7.9.0

Browser:

  • [ ] Chrome (desktop)
  • [ ] Chrome (Android)
  • [ ] Chrome (iOS)
  • [ ] Firefox
  • [ ] Safari (desktop)
  • [ ] Safari (iOS)
  • [ ] IE
  • [ ] Edge

Thanks. I will have a look. Sometimes Mongo will just pick the wrong index. I was not able to fix this and I am not sure if I can fix it.

Where is the first query coming from? Looks a like a custom asset query. These queries cannot be optimized.

What is an asset ID? I think we use just squidex .net client & generated API from swagger i think that should not be anything special.

edit: From app ID i think it is just IAssetsClient and calling GetAllAsync as there is "skip": 13600, in the query

Thats weird. Can you update your client library? Perhaps an older version is making a weird query here.

We use Squidex.ClientLibrary with version 16.1.0 at least believe we use (not sure if nuget can resolve older version). Is it the last version? Wasn’t it replaced with something else, as last update on nuget is about 3 months ago.

Thats the newest one. But I don’t understand where the ordering in the query is coming from. This is the reason why the index is not used any why the query is slow.

I try to debug what http requests are sent (and mostly cause slow queries). And it seems like it is just api/apps/app/assets?%24top=100&%24skip=400.

Non assets queries which we use in generated client (i think it is similar what squidex SDK use but may be “outdated” as i wrote that long time ago and NSwag is somehow tricky to use). api/content/app/schema/%24top=100&%24skip=100&%24orderby=created%20desc

The default order should be just the opposite…

this means:

ID ASC, LastModified DESC
"sort": {
      "id": 1,
      "mt": -1
    }

But it should be `LastModified DESC, ID ASC"

you mean for “assets” query or for “content”.

The content part is logic in our app and most likely we do not need orderby at all if it loads all entries anyway.

But assets are just GetAllAsync called on default IAssetsClient

For content query i try to remove “orderby” (which should then use “default” value?). But was still able to found slow query in log (it may be cause that this was run on same instance where the actual slow query slowing mongo - i am not an expert on mongo at all).

   {
  "command": {
    "$db": "SquidexContent",
    "filter": {
      "_ai": "97432068-10f9-4b98-81ba-ef93a96cc466",
      "_si": {
        "$in": [
          "5769cadb-3be6-4a79-bb39-1a9d23cb418c"
        ]
      },
      "dl": {
        "$ne": true
      },
      "id": {
        "$gt": "00000000-0000-0000-0000-000000000000"
      },
      "mt": {
        "$gt": {
          "$date": "1970-01-01T00:00:00.000Z"
        }
      }
    },
    "find": "States_Contents_Published3",
    "limit": 100,
    "lsid": {
      "id": {
        "$uuid": "dcfb1675-cf17-40b8-8a46-d5e023e29afa"
      }
    },
    "projection": {
      "dd": 0
    },
    "skip": 3500,
    "sort": {
      "id": 1,
      "mt": -1
    }
  },
  "cursorExhausted": true,
  "docsExamined": 16622,
  "durationMillis": 3994,
  "hasSortStage": true,
  "keysExamined": 16623,
  "locks": {
    "FeatureCompatibilityVersion": {
      "acquireCount": {
        "r": 56
      }
    },
    "Global": {
      "acquireCount": {
        "r": 56
      }
    },
    "Mutex": {
      "acquireCount": {
        "r": 1
      }
    }
  },
  "nreturned": 100,
  "ns": "SquidexContent.States_Contents_Published3",
  "numYields": 55,
  "planCacheKey": "537DA32C",
  "planSummary": "IXSCAN { _si: 1, dl: 1, mt: -1 }",
  "protocol": "op_msg",
  "queryFramework": "classic",
  "queryHash": "1BA1A25F",
  "remote": "10.0.28.4:37782",
  "reslen": 626010,
  "storage": {},
  "type": "command"
}

Yes, I am talking about the first dump.