Hello together,
at the moment I am trying to understand the memory usage of Squidex installations to make improvements. Of course the cloud is a very good candidate to collect statistics but I am looking for more data.
If you want to help me you can create either
- Process dumps (using dotnet-dump)
- Memory dumps (using dotnet-gcdump)
A full tutorial how to do this is available in the docs now: https://docs.squidex.io/01-getting-started/installation/troubleshooting-and-support/diagnose-runtime-issues
If you have a running instance that consumes more than 3 GB (more is better) a dump would be welcome. Just following the tutorial, upload your dump to a cloud storage and send me a link via PM.
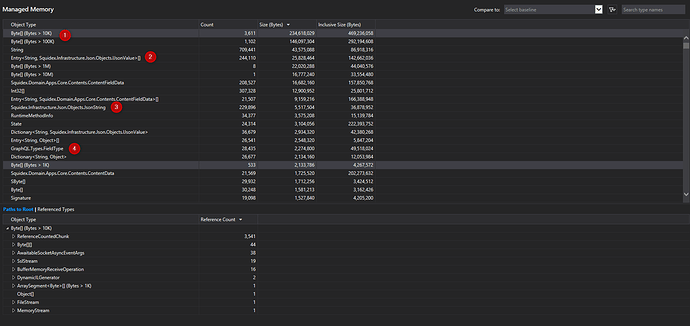
Such a memory dump provides a lot of useful information as you can see in the following screen:
It is possible to analyze the memory usage there:
- Most memory is allocated for byte buffers, these buffers are used for:
- The web server (kestrel)
- The image library to resize images.
- The MongoDb driver to read data from the database.
- The second interesting entry are cached content entities and it is worth it to have a look, why so many entries are cached.
- The json strings are also part of the content entities and part of (2).
- The graphql servers also needs a little bit of memory for all the GraphQL types.
