[INACTIVE] Randomly getting "TimeoutException" when updating content

I’m submitting a…

  • [ ] Regression (a behavior that stopped working in a new release)
  • [X] Bug report
  • [ ] Performance issue
  • [ ] Documentation issue or request

Current behavior

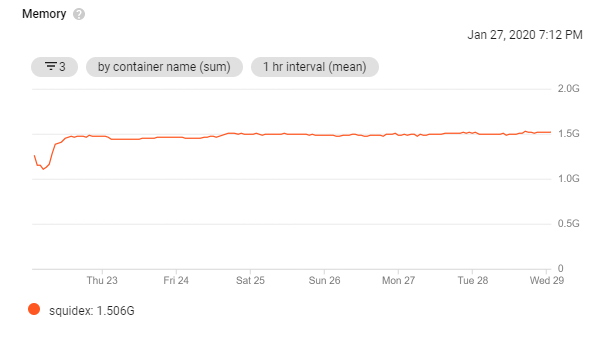
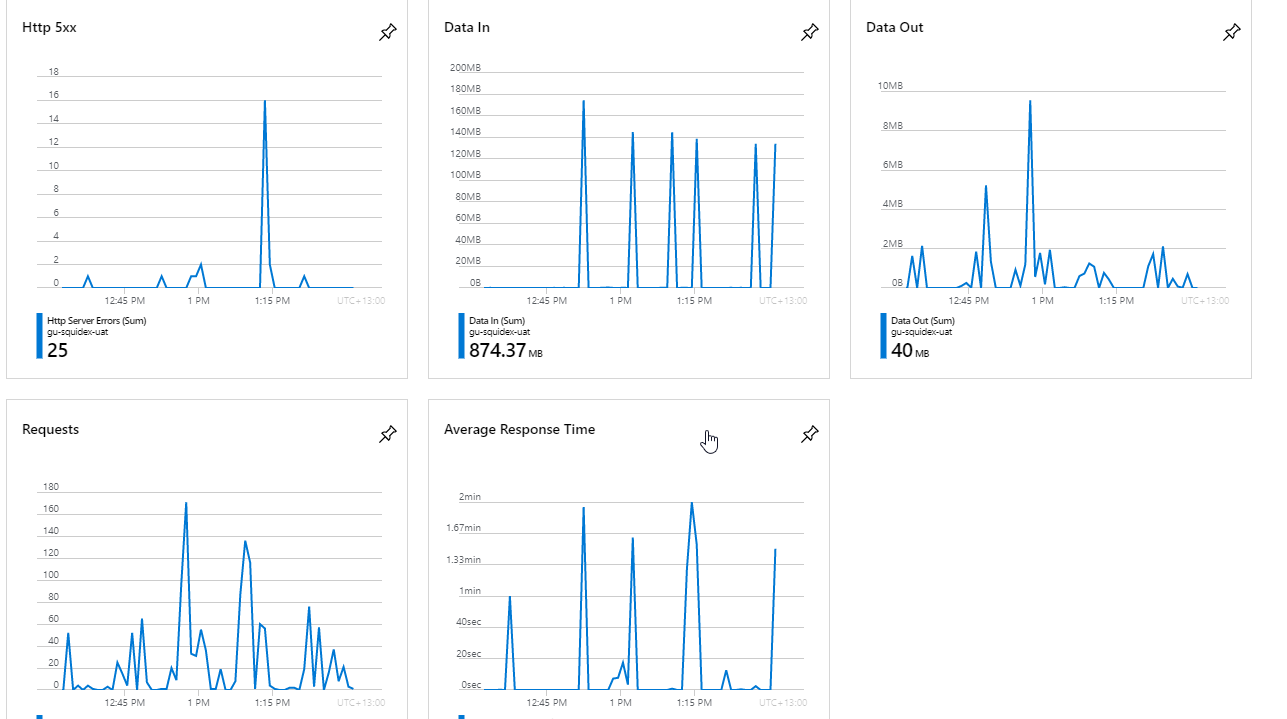
Users are adding content & assets and randomly getting errors when clicking Save. Average response time is going up from <1 second to up to 5 minutes. Already increased server specs from 1.75GB to 7GB as we saw high memory usage before; don’t see high memory usage anymore.

In the logs, seeing:

{
"logLevel": "Error",
"message": "Connection id \u00220HLT0GC5RTGV4\u0022, Request id \u00220HLT0GC5RTGV4:00000001\u0022: An unhandled exception was thrown by the application.",
"eventId": {
     "id": 13,
     "name": "ApplicationError"
   },
   "connectionId": "0HLT0GC5RTGV4",
   "traceIdentifier": "0HLT0GC5RTGV4:00000001",
   "exception": {
     "type": "System.TimeoutException",
     "message": "Response did not arrive on time in 00:00:30 for message: NewPlacement Request S172.16.1.3:11111:317534875*cli/2c0d4583@9e3161a8-\u003ES172.16.1.3:11111:317534875*grn/54B2229A/b1d1b18c@d8408ebc #1797878: . Target History is: \u003CS172.16.1.3:11111:317534875:*grn/54B2229A/b1d1b18c:@d8408ebc\u003E.",
     "stackTrace": "   at Orleans.Internal.OrleansTaskExtentions.\u003CToTypedTask\u003Eg__ConvertAsync|4_0[T](Task\u00601 asyncTask)\n   at Squidex.Infrastructure.Commands.GrainCommandMiddleware\u00602.ExecuteCommandAsync(TCommand typedCommand) in /src/src/Squidex.Infrastructure/Commands/GrainCommandMiddleware.cs:line 49\n   at Squidex.Infrastructure.Commands.GrainCommandMiddleware\u00602.ExecuteCommandAsync(CommandContext context) in /src/src/Squidex.Infrastructure/Commands/GrainCommandMiddleware.cs:line 40\n   at Squidex.Infrastructure.Commands.GrainCommandMiddleware\u00602.HandleAsync(CommandContext context, Func\u00601 next) in /src/src/Squidex.Infrastructure/Commands/GrainCommandMiddleware.cs:line 30\n   at Squidex.Domain.Apps.Entities.Contents.ContentCommandMiddleware.HandleAsync(CommandContext context, Func\u00601 next) in /src/src/Squidex.Domain.Apps.Entities/Contents/ContentCommandMiddleware.cs:line 42\n   at Squidex.Infrastructure.Commands.GrainCommandMiddleware\u00602.HandleAsync(CommandContext context, Func\u00601 next) in /src/src/Squidex.Infrastructure/Commands/GrainCommandMiddleware.cs:line 30\n   at Squidex.Domain.Apps.Entities.Assets.AssetCommandMiddleware.HandleCoreAsync(CommandContext context, Func\u00601 next) in /src/src/Squidex.Domain.Apps.Entities/Assets/AssetCommandMiddleware.cs:line 140\n   at Squidex.Domain.Apps.Entities.Assets.AssetCommandMiddleware.HandleAsync(CommandContext context, Func\u00601 next) in /src/src/Squidex.Domain.Apps.Entities/Assets/AssetCommandMiddleware.cs:line 125\n   at Squidex.Domain.Apps.Entities.Apps.AppCommandMiddleware.HandleAsync(CommandContext context, Func\u00601 next) in /src/src/Squidex.Domain.Apps.Entities/Apps/AppCommandMiddleware.cs:line 56\n   at Squidex.Domain.Apps.Entities.Schemas.Indexes.SchemasIndex.HandleAsync(CommandContext context, Func\u00601 next) in /src/src/Squidex.Domain.Apps.Entities/Schemas/Indexes/SchemasIndex.cs:line 136\n   at Squidex.Domain.Apps.Entities.Rules.Indexes.RulesIndex.HandleAsync(CommandContext context, Func\u00601 next) in /src/src/Squidex.Domain.Apps.Entities/Rules/Indexes/RulesIndex.cs:line 89\n   at Squidex.Domain.Apps.Entities.Apps.Indexes.AppsIndex.HandleAsync(CommandContext context, Func\u00601 next) in /src/src/Squidex.Domain.Apps.Entities/Apps/Indexes/AppsIndex.cs:line 221\n   at Squidex.Domain.Apps.Entities.Apps.Invitation.InviteUserCommandMiddleware.HandleAsync(CommandContext context, Func\u00601 next) in /src/src/Squidex.Domain.Apps.Entities/Apps/Invitation/InviteUserCommandMiddleware.cs:line 45\n   at Squidex.Infrastructure.Commands.CustomCommandMiddlewareRunner.HandleAsync(CommandContext context, Func\u00601 next) in /src/src/Squidex.Infrastructure/Commands/CustomCommandMiddlewareRunner.cs:line 33\n   at Squidex.Web.CommandMiddlewares.EnrichWithSchemaIdCommandMiddleware.HandleAsync(CommandContext context, Func\u00601 next) in /src/src/Squidex.Web/CommandMiddlewares/EnrichWithSchemaIdCommandMiddleware.cs:line 55\n   at Squidex.Web.CommandMiddlewares.ETagCommandMiddleware.HandleAsync(CommandContext context, Func\u00601 next) in /src/src/Squidex.Web/CommandMiddlewares/ETagCommandMiddleware.cs:line 63\n   at Squidex.Infrastructure.Commands.InMemoryCommandBus.PublishAsync(ICommand command) in /src/src/Squidex.Infrastructure/Commands/InMemoryCommandBus.cs:line 42\n   at Squidex.Areas.Api.Controllers.Contents.ContentsController.InvokeCommandAsync(ICommand command) in /src/src/Squidex/Areas/Api/Controllers/Contents/ContentsController.cs:line 450\n   at Squidex.Areas.Api.Controllers.Contents.ContentsController.PostContent(String app, String name, NamedContentData request, Boolean publish) in /src/src/Squidex/Areas/Api/Controllers/Contents/ContentsController.cs:line 287\n   at Microsoft.AspNetCore.Mvc.Infrastructure.ActionMethodExecutor.TaskOfIActionResultExecutor.Execute(IActionResultTypeMapper mapper, ObjectMethodExecutor executor, Object controller, Object[] arguments)\n   at Microsoft.AspNetCore.Mvc.Infrastructure.ControllerActionInvoker.\u003CInvokeActionMethodAsync\u003Eg__Logged|12_1(ControllerActionInvoker invoker)\n   at Microsoft.AspNetCore.Mvc.Infrastructure.ControllerActionInvoker.\u003CInvokeNextActionFilterAsync\u003Eg__Awaited|10_0(ControllerActionInvoker invoker, Task lastTask, State next, Scope scope, Object state, Boolean isCompleted)\n   at Microsoft.AspNetCore.Mvc.Infrastructure.ControllerActionInvoker.Rethrow(ActionExecutedContextSealed context)\n   at Microsoft.AspNetCore.Mvc.Infrastructure.ControllerActionInvoker.Next(State\u0026 next, Scope\u0026 scope, Object\u0026 state, Boolean\u0026 isCompleted)\n   at Microsoft.AspNetCore.Mvc.Infrastructure.ControllerActionInvoker.\u003CInvokeInnerFilterAsync\u003Eg__Awaited|13_0(ControllerActionInvoker invoker, Task lastTask, State next, Scope scope, Object state, Boolean isCompleted)\n   at Microsoft.AspNetCore.Mvc.Infrastructure.ResourceInvoker.\u003CInvokeNextExceptionFilterAsync\u003Eg__Awaited|25_0(ResourceInvoker invoker, Task lastTask, State next, Scope scope, Object state, Boolean isCompleted)\n   at Microsoft.AspNetCore.Mvc.Infrastructure.ResourceInvoker.Rethrow(ExceptionContextSealed context)\n   at Microsoft.AspNetCore.Mvc.Infrastructure.ResourceInvoker.Next(State\u0026 next, Scope\u0026 scope, Object\u0026 state, Boolean\u0026 isCompleted)\n   at Microsoft.AspNetCore.Mvc.Infrastructure.ResourceInvoker.\u003CInvokeNextResourceFilter\u003Eg__Awaited|24_0(ResourceInvoker invoker, Task lastTask, State next, Scope scope, Object state, Boolean isCompleted)\n   at Microsoft.AspNetCore.Mvc.Infrastructure.ResourceInvoker.Rethrow(ResourceExecutedContextSealed context)\n   at Microsoft.AspNetCore.Mvc.Infrastructure.ResourceInvoker.Next(State\u0026 next, Scope\u0026 scope, Object\u0026 state, Boolean\u0026 isCompleted)\n   at Microsoft.AspNetCore.Mvc.Infrastructure.ResourceInvoker.\u003CInvokeFilterPipelineAsync\u003Eg__Awaited|19_0(ResourceInvoker invoker, Task lastTask, State next, Scope scope, Object state, Boolean isCompleted)\n   at Microsoft.AspNetCore.Mvc.Infrastructure.ResourceInvoker.\u003CInvokeAsync\u003Eg__Logged|17_1(ResourceInvoker invoker)\n   at Microsoft.AspNetCore.Routing.EndpointMiddleware.\u003CInvoke\u003Eg__AwaitRequestTask|6_0(Endpoint endpoint, Task requestTask, ILogger logger)\n   at NSwag.AspNetCore.Middlewares.OpenApiDocumentMiddleware.Invoke(HttpContext context)\n   at Microsoft.AspNetCore.Authorization.AuthorizationMiddleware.Invoke(HttpContext context)\n   at Microsoft.AspNetCore.Authentication.AuthenticationMiddleware.Invoke(HttpContext context)\n   at Microsoft.AspNetCore.Builder.Extensions.MapMiddleware.Invoke(HttpContext context)\n   at Squidex.Web.Pipeline.EnforceHttpsMiddleware.InvokeAsync(HttpContext context, RequestDelegate next) in /src/src/Squidex.Web/Pipeline/EnforceHttpsMiddleware.cs:line 45\n   at Microsoft.AspNetCore.Builder.UseMiddlewareExtensions.\u003C\u003Ec__DisplayClass5_1.\u003C\u003CUseMiddlewareInterface\u003Eb__1\u003Ed.MoveNext()\n--- End of stack trace from previous location where exception was thrown ---\n   at Squidex.Web.Pipeline.LocalCacheMiddleware.InvokeAsync(HttpContext context, RequestDelegate next) in /src/src/Squidex.Web/Pipeline/LocalCacheMiddleware.cs:line 32\n   at Microsoft.AspNetCore.Builder.UseMiddlewareExtensions.\u003C\u003Ec__DisplayClass5_1.\u003C\u003CUseMiddlewareInterface\u003Eb__1\u003Ed.MoveNext()\n--- End of stack trace from previous location where exception was thrown ---\n   at Squidex.Web.Pipeline.RequestLogPerformanceMiddleware.InvokeAsync(HttpContext context, RequestDelegate next) in /src/src/Squidex.Web/Pipeline/RequestLogPerformanceMiddleware.cs:line 48\n   at Microsoft.AspNetCore.Builder.UseMiddlewareExtensions.\u003C\u003Ec__DisplayClass5_1.\u003C\u003CUseMiddlewareInterface\u003Eb__1\u003Ed.MoveNext()\n--- End of stack trace from previous location where exception was thrown ---\n   at Microsoft.AspNetCore.Builder.Extensions.MapMiddleware.Invoke(HttpContext context)\n   at Microsoft.AspNetCore.Builder.Extensions.MapWhenMiddleware.Invoke(HttpContext context)\n   at Microsoft.AspNetCore.Builder.Extensions.MapWhenMiddleware.Invoke(HttpContext context)\n   at Microsoft.AspNetCore.Builder.Extensions.MapWhenMiddleware.Invoke(HttpContext context)\n   at Microsoft.AspNetCore.Server.Kestrel.Core.Internal.Http.HttpProtocol.ProcessRequests[TContext](IHttpApplication\u00601 application)"
   },
   "app": {
     "name": "Squidex",
     "version": "1.0.0.0",
     "sessionId": "15a06d39-9195-498e-b55a-1096fbe19065"
   },
   "web": {
     "requestId": "4af47825-680f-4b0d-bc4c-f470d03ffdf3",
     "requestPath": "/api/content/gearup-uat/winwire",
     "requestMethod": "POST"
   },
   "timestamp": "Z",
   "category": "Microsoft.AspNetCore.Server.Kestrel"
 }

Expected behavior

The users can edit content without problems.

Environment

  • [X] Self hosted with docker
  • [ ] Self hosted with IIS
  • [ ] Self hosted with other version
  • [ ] Cloud version

Others:
Hosted on Azure. Mongo hosted on a separate VM. Currently using P2v2 for the single App Service Plan, so only one node.
I also noticed that once in a while memory usage drops to 0%, but not always when the problem occurs.

I don’t know why, but it seems that in azure the nodes get restarted a lot or they just crash. I do not have this issue in the squidex cloud. Also the memory usage seems strange to me. I made a lot of memory profiling last week and have not seen anything strange.

I really need more infos to support you, like logs or events from azure if the node has crashed and why because I have no production system in Azure, only running in GCE on kubernetes.

By the way. The average memory usage in my system is less than 2GB per node.

image

Thanks for your reply.
There are 3 separate problems on hand here:
1 Memory usage went up to 100% when using a 1.75GB node, this was resolved by scaling up to 7GB. So this seems to be no longer an issue.
2 Random container restarts
3 TimeoutException, see above. I’ve disabled clustering (orleans setting set to Development), why is this occurring?

Are you able to help me with 3 now please? See stacktrace above. I’ll do more digging into 2 by investigating logs.

No idea about the timeouts, right now. Could be related to 2.

Some more graphs, the average response time going up to 2 minute seems to be the culprit.
With this amount of requests (up to ~200 / minute) is 1 node enough? Doesn’t seem to be a massive amount.
our users are mainly editing content & uploading assets. Assets are stored on an Azure Storage account.

Some stats from the storage account:

It looks normal. The average response time can be long for asset, as it is I/O bound.

But you can see that nothing is stored in memory here: https://github.com/Squidex/squidex/blob/master/backend/src/Squidex/Areas/Api/Controllers/Assets/AssetContentController.cs

The only thing that can potentially cause performance issues are very big assets. If you have a 5MB and you create a thumbnail. You have to decompress it, store it in memory temporarily (Which are very likely 30MB) and then resize it. This is Memory and CPU intensive.

About the timeout issue I might be able to provide some additional information.

Our situation: We are currently developing software and Squidex was being hosted in a B1 service plan. Everything is early stage so many changes to the schema.

We encountered the problem in two scenarios:

  1. We noticed that the rules in Squidex wouldn’t trigger. When we navigated to the rules of that app we would get an error (when just loading the rules) and the logs revealed a System.TimeoutException. Reloading the admin-page didn’t work. After spending a good 30 minutes on it I decided to ignore it, however two hours later when I checked again it was gone. No restart, nothing.
  2. Later that day we had the exact same problem however this happened when we try to update the content of a singular scheme (our homepage). At first there was a good chance that we could update, but the more changes I made the more likely it became I would get a System.TimeoutException.

As for the exception. It is exactly the same as what the original poster has written (except our requestPath and id’s are different).

Our current solution has been upgrading the service plan from B1 to B2.

A few things I noticed:

  1. The problem will go away on it’s own without restarts, but there is no guarantee.
  2. The problem is hard to reproduce reliable.
  3. Our problem didn’t occur with assets but with content changes or looking up the rules.
  4. According to Azure we didn’t max out the memory or CPU. Although memory average was at 75% when the problem occurs on the B1 plan. We are currently at average 49% on B2 plan (which has twice the RAM as B1 plan). So calculating backwards (and this is most likely wrong) that would mean the actual memory pressure on the B1 plan should have been close to 98% and not 75%. Which would mean that it’s memory bound.

A few assumptions that I made:

  1. Orleans seems to be the problem and I’m using it has internal memory management.
  2. Orleans tries to allocate additional memory, but notices it needs more, so it tries to grow it’s internal memory, which fails, which causes retries, which causes timeout.

Log file: https://gist.github.com/DevWouter/3648939ab50bb003e520ecc37074b11c

Can you send me a backup of your database? It is strange that it only happens on content updates.

Which version do you run?

About your assumptions:

  1. Orleans seems to be the problem and I’m using it has internal memory management.

A year ago I would have agreed, but in my experience Orleans is very stable now. It shows the error but it does not mean that it is the root cause. For example when there is a deadlock or so in the update content path, Orleans would show the same error. The good thing about Orleans is that it records the timeouts.

  1. Orleans tries to allocate additional memory, but notices it needs more, so it tries to grow it’s internal memory, which fails, which causes retries, which causes timeout

Orleans itself does not try to allocate memory, but the actors do and they stay in-memory. But usually there are very small (< KB)

I won’t be able to do that because of production-ready data. But I can provide you with the homepage-scheme (it’s a single content scheme).
Although the scheme refers to assets the problem occurred when I simply changed the ContactButtonText as I just made that part of the page dynamic. I also reproduced the error by simply hitting the save button when nothing has changed.

As for the rules, there was only 1 rule in it which triggers on a content-changed event (event.type == "created") to send the signup-event to an azure queue. I do notice I can no longer find these errors in the logs, yet I’m quite certain I saw them, so the logs are likely incomplete. (Oh, the “joy” of programming…)

My writing here is awful. What I meant to say is that problem appears to manifest in Orleans and that it might relate to how Orleans manages it memory.

Then I consider that assumption false, which in turn makes my first assumption false as well.

At this point I’m curious if the root cause is the lack of available memory. It is something I have observed, but with my assumptions gone I see no triggers for that problem to occur. We might be able to exclude that by seeing if we can reproduce the error in a near-low-memory setup (using docker for example).
If we see another error occur then maybe the problem is something else entirely. Although if the same error does occur… Well, we still need to figure out what is eating the memory (which might also be caused by something else then Squidex).

I agree that low memory is an issue, but what I do not understand is the sudden spike from < 50ms to >30 sec and that Squidex Cloud needs less memory than what you have available.

The 30 sec are a timeout, it does not mean that it takes only 30 sec, it could just hang forever. I while ago I had a bug that user defined regex validation can cause a performance hit, but I introduced a regex timeout for that. (There are a few regex that just take forever).

What also worries me is that you are not the only one with this issue. All issues are on Azure only, which is an indicator, but because of the tech stack Azure is very likely the most used cloud. Squidex Cloud is on GCE and the biggest customers are mainly on AWS.

What would you consider the minimal system requirement? Later this week I will start working on the deploy pipeline and I don’t mind spending an extra two hours to setup a test to see if I can reproduce the issue using docker/kubernetes on my dev-machine.

I just noticed that in the logfile on line 13956 there is a reference to an AssetCommandMiddleware. I’m 100% certain I can trigger the problem by just opening the content of the scheme and hitting save with touching any file.
But… the scheme does uses assets, so my scenario might overlap have more in common with @rolandoldengarm scenario (which I assume has more users then my scenario)

Although I won’t exclude vendor-specific issue there are a lot more variables at play. For example: There is no documentation for GCE or AWS and as such it’s likely that the adoption rate for azure is higher.

PS: It seems the system considers me spam due to the links to the gist on github. So no useful links or a readable stacktrace in this one :sweat_smile:

I will also setup an environment and write a sample app that is constantly making requests, lets see if I find something.

Btw: Yesterday I published this site: https://squidex.io/features

The content is also stored in squidex cloud and is using assets.

Can you also try to latest master release? It contains a fix where the asset metadata are extracted without opening the image.

Can you send me your schema again? I have clicked the wrong button and no your link to gist is gone.

I found something. The deep equal library I use has a bug and runs out of memory. I could not reproduce it with unit tests, therefore i have written my own system.

The library: https://github.com/jamesfoster/DeepEqual

@DevWouter thanks for chiming in! Good to see I’m not the only one with this issue.

@Sebastian Good find re the comparer. That’s fixed in this PR, right? https://github.com/Squidex/squidex/pull/477/files
Our Squidex code is on version “4.0.0 Beta 1 - 2019-10-27” FWIW. I’ll upgrade to the latest version soon too.

We also upgraded the storage account from Standard (conventional disks) to Premium (SSD) which seem to have improved things.

Yes, it is the fix, but it needs more testing. I will merge it in today or tomorrow

1 Like

@Sebastian that is awesome! Will update as soon as you have merged it in.
How can I track what’s causing the performance issues we’re seeing? What log entries should I be looking for?

There is no guarantee yet, that this was the root cause, but I have seen scenarios where the deep comparer ended in an infinite loop and because it has added the found differences to a collection this collection was growing very fast until the process was running out of memory. And of course it was also blocking the thread.

1 Like

Thanks @Sebastian.

We will upgrade to the latest Squidex version soon.
How can we trace slow performance? We’re logging everything (from Debug log level) to Application Insights. That generates a LOT of log entries, just wondering what to look for.