Could be, but it is coming from your client. Do you have load tests or API tests or so? I can see in the logs that all requests are done via the graphql endpoint.
What also looks suspicious is that you do a lot of duplicate requests on your site. I see getArticle twice, getStaticContent twice and so on.
You are always loading the content for EN and zh-TW
@Sebastian No tests have been implemented, In the logs we can only see all calls are via API GraphQL POST and hence don’t have further details to ascertain which queries are repeatedly being called so that we can diagnose which calls are the culprit. We are also running the mobile and desktop builds locally but don’t have any repeated calls.
A few more things:
-
You have to notice that each requests has a cost associated. Some API calls only costs 0.1 calls, and graphql costs 2 calls, because you can do very heavy requests with GraphQL.
-
There is a batch endpoint for graphql: https://www.apollographql.com/blog/batching-client-graphql-queries-a685f5bcd41b/ The endpoint for batching ends with /graphql/batch instead of /graphql
-
You can save API calls with a CDN. For example you could use cloudflare as an edge server and route all requests through and then define a short cache duration for some of the API calls. But you have to move to GET requests then.
I don’t think that there is something fundamentally wrong with the request logs.
@Sebastian Humble request !!! Is it possible to get a dump of detailed logs(beyond the ones I downloaded from the Squidex Dashboard) for like last 2-3 days for our Cloud Instance for API calls that are made
e.g.
What queries are being made for each POST request. That will help us internally narrow down the API calls. Basically the PAYLOAD of each query for last couple of days
I understand your recommendations on COST per GraphQL API Calls and the Caching Optimisations. I am more concerned around the REPEATED CALLS for LOADING DATA via POST requests (which creates a feeling of AUTOMATED TESTs) as the underlying problem that needs to fixed to reduce majority of the bulk calls.
Hi, the problem is that I cannot log the POST payloads. It is just too much data, I do not have it available.
I can extend the logging to store query strings as well, then you will have the information when you use GET instead of POST.
If you create a new client and test it for a few hours it is is very unlikely that somebody else is using it. Then you can log it on your side. For example, you can use google analytics for that.
I have been monitoring the calls and we reduced couple of our other instances using Squidex API just to see the API Usage the outcome was on one day the calls overshot the previous day and the next day it subsided.
I am sure now there is another reason beyond our reach why these usage statistics of this high order is happening.
Based on your recommendation I am going to try and replace the API keys in our builds just to ensure unauthorised usage is not happening when it comes to stress testing through some unknown actor
@Sebastian it seems something erroneous(funny) has started again for API calls usage since yesterday. It seems to consuming the API count and has already crossed our monthly quota in 1.5 day. PFA the screenshot here and logs also. I am going to make key replacement as an interim fix but I am not sure what is the issue here.
API QUOTA BURNOUT in 1.5 DAYS like 500k Calls
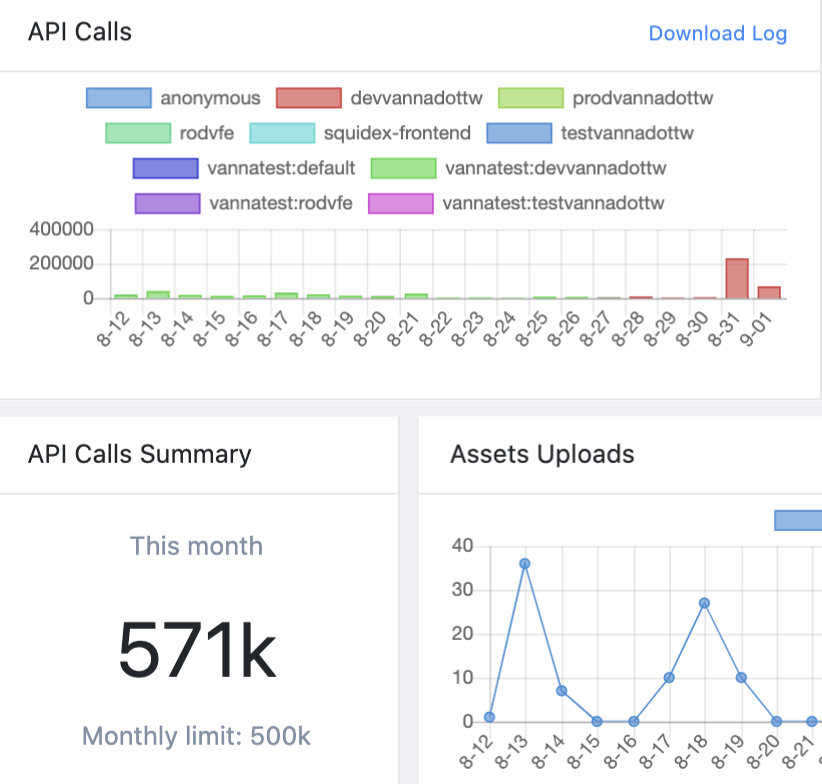
LOGS
https://drive.google.com/file/d/1-aOqcvKYpMBuLnO7rs9j06NYwlb1DFax/view?usp=sharing
I have reset your usage data and will have a look now.
@Sebastian no relief on this front. It seems to be there are some retry calls that keep happening as a result of which the number of calls never subside. This issue is still unresolved.
Also we recently got charged for API calls but this somehow is undetectable why such heavy number of calls are being made. I have changed API keys as well yet it keeps on happening.
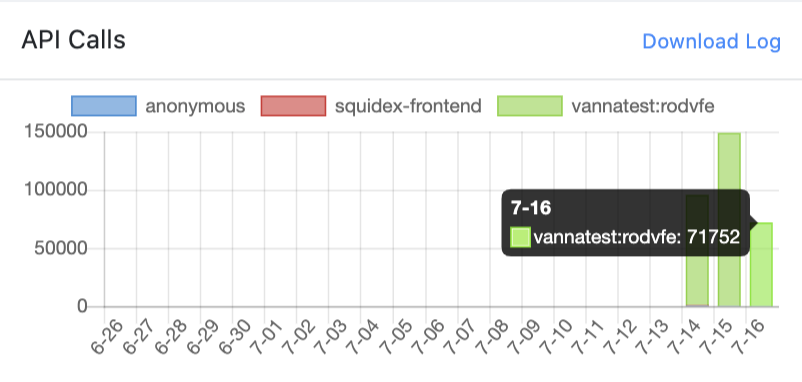
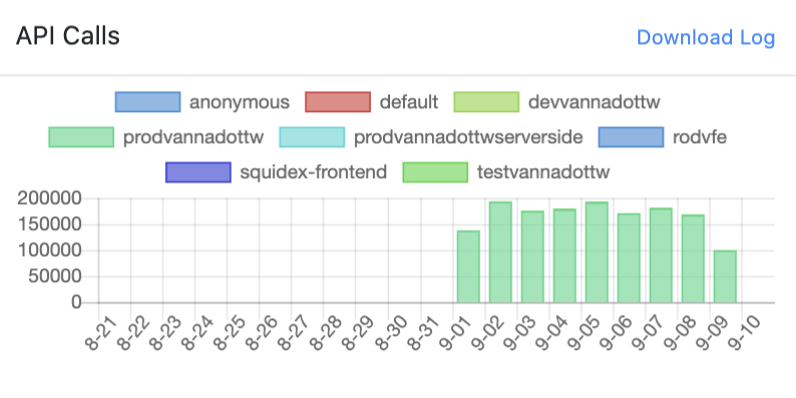
This is vannatest app in the cloud
Have you checked the logs? You could put in excel and see what causes the highest number.
Squidex does not do any retry calls.
Hi @Sebastian.
I checked the logs and I found an anomaly not sure if it is a Dashboard Bug or a wrong logs file bug.
I checked the logs. They are also available here for mutual discussion. I exported the latest one from last night using the Cloud App : vannatest
https://docs.google.com/spreadsheets/d/1_F9T1hOCQAUwD-ILYmr5ZlBCqWg-iHcnwHNHyMRxdj0/edit?usp=sharing
Anomaly Noticed at my API Dashboard and Squidex Logs Level
On searching for the key in the above logs file i.e vannatest:prodvannadottw search string is missing from the logs and it returns 0 results. But if you look at the Dashboard it is saying vannatest:prodvannadottw key is responsible for disproportionate API calls as per the screen shot
We are also looking at our own level but here is my potential theory for plausible explanation of a bug at Squidex level as the logs file is mismatching with no current key vannatest:prodvannadottw but reporting somehow old logs using keys vannatest:devvannadottw and vannatest:rodvfe
My hesitation is to switch off these keys and remove them but since it is the production app I run the risk of shutting my app down incase if it was indeed a bug at our side.
The name of a client is for example “default”, but when you request the access token for such a client the name “default” is not unique of course.
Therefore you need a full qualified name like myapp:myclient to request an access token. I have decided to remove the “myapp” prefix from the chart. Thats it.
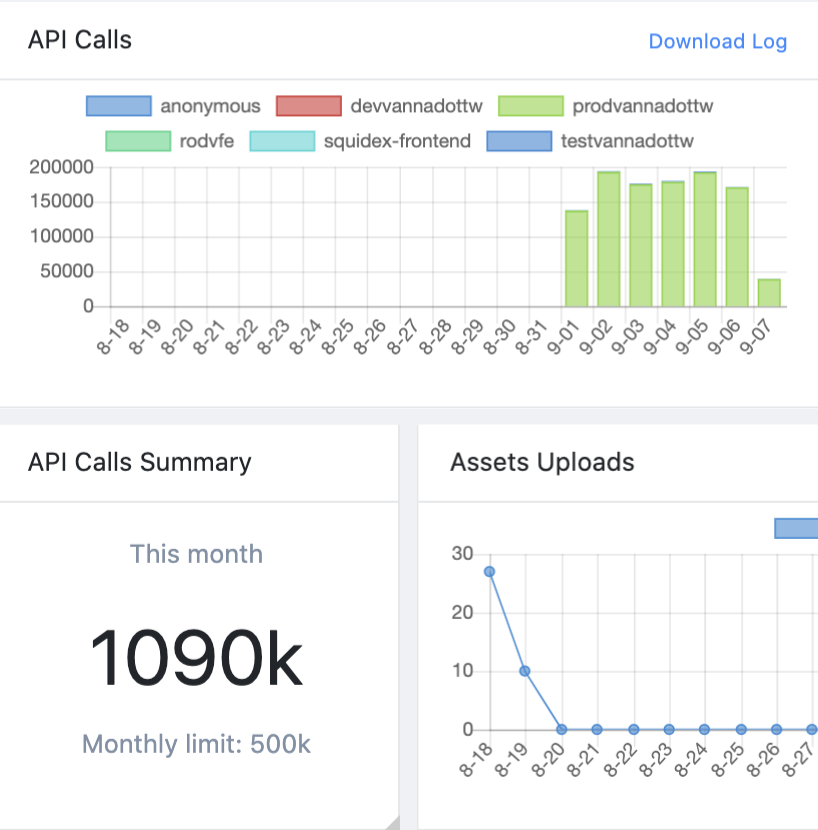
Now we are unable to make changes to Schema in vannatest app because of API limit Calls. Yesterday the API calls stopped suddenly
I can reset your calls, but I have to invoice them and you have to find out who is making these calls. It is nothing I can do
1 Like
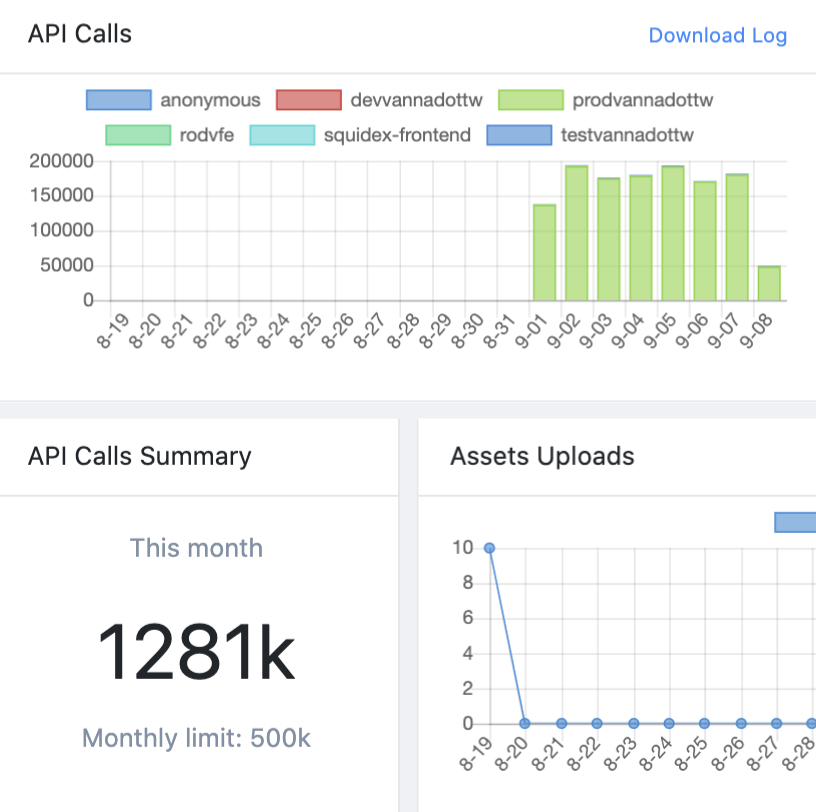
Please reset it asap, our PRODUCTION Squidex is down on vanna.tw website. We need to get it back up. Our API Calls have been restricted because of this issue.
We are getting this error. Please reset asap. Our production platform(vanna.tw) is still down since last 4 hours
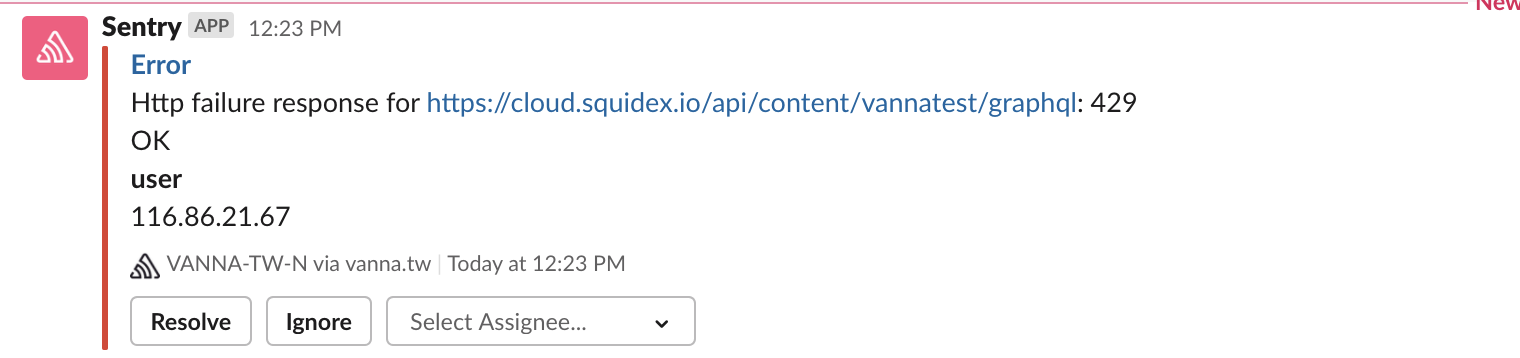
{"traceId":"|db5978f1-400937c9e01e4852.","type":"https://tools.ietf.org/html/rfc7235#section-3.1","statusCode":401}
Done, I have reset it.
1 Like
@Sebastian Thanks. We are back up live
Do you think we should go on to the higher plan, if such a bug were to happen again we would be insured against such extra API calls pricing?
I think from your point of view I would investigate first what causes the most calls. Very often it is something like a menu structure that does not happen very often, so you can cache it.
You can also go over CDN, because all calls there only cost the half.