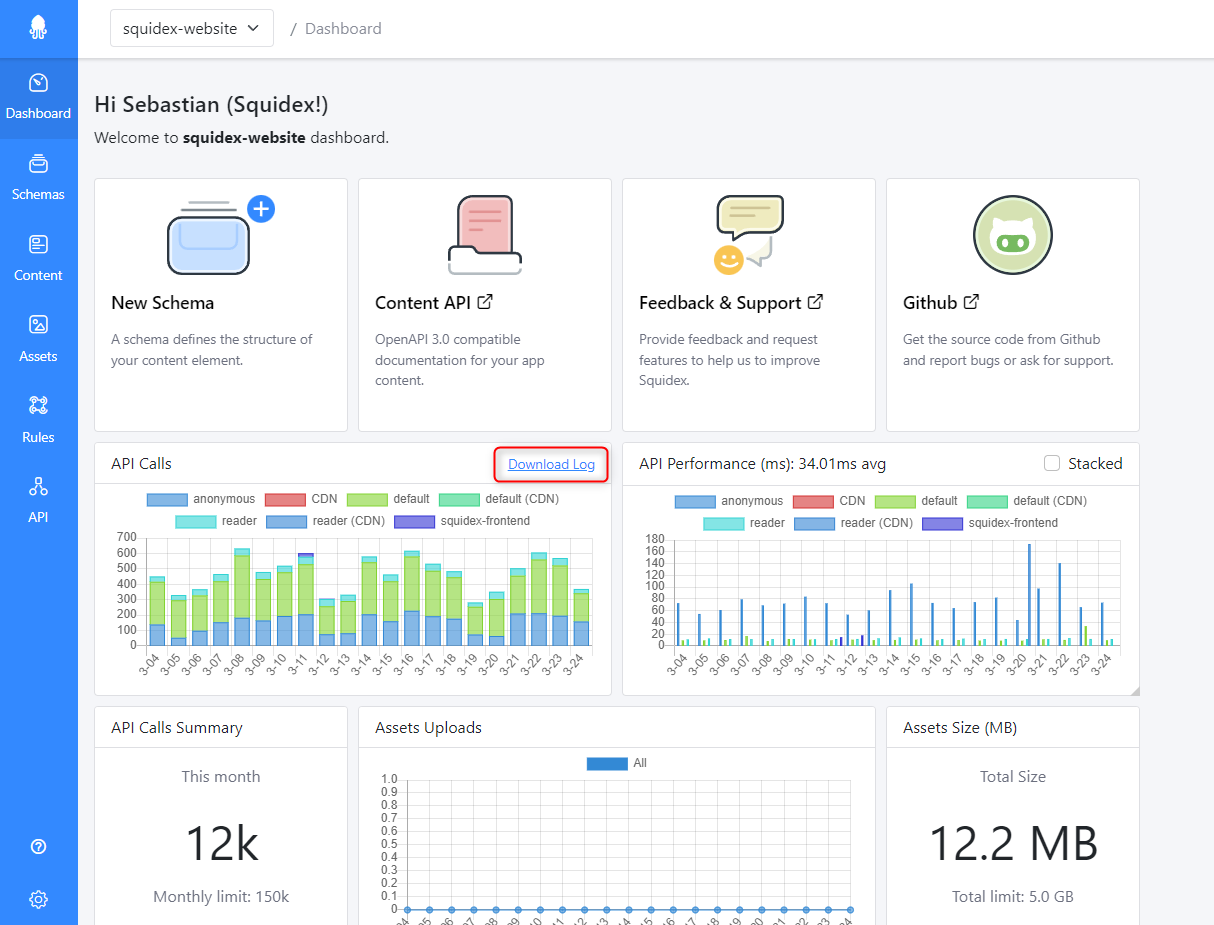
As we are reaching the traffic limits on our application we wanted to see a monthly breakdown of the usage to help us assess any abnormalities however it seems that the only place to look it up is the main dashboard where only a very limited preview of the last couple of weeks is visible. Is there any plan to provide better visibility?
We have not yet tested the given solution however we still believe that the breakdown visible in the UI should be a little more details otherwise it’s hard to track it. But I will definitely give your method a go
I understand that, but there are so many different requirements that it is hard to build something that just works. So the only solution would be to push the data into something like ELK and to provide a iframe solution or so to analyze your data there.
It is also a lot data. Several millions of records per month, so it is not an easy task.