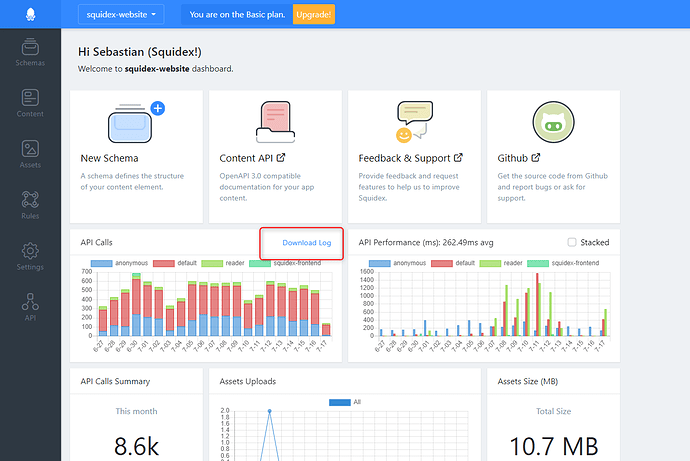
I was considering upgrading to a paid report because the usage started getting close to the free limit, but then I started look at the details. The API usage was going up, but my website traffic was going down. I rotated my API key and even set a limit on my client to make sure I had controls in place to not exceed the limit.
Since I put more controls in place my website analytics show that if anything usage is trending down but your reports show a massive spike of 15k requests on 6/30 and then you shut me off for the entire month of July for exceeding the limit.
Up until now, I’ve been very happy with your platform and have been considering upgrading to the paid plan more because I wanted to support what you are doing than my requirements. I’ve also been talking to my clients about switching from Kentico Kontent to your platform.
At this point however, I feel like I’m being coerced into paid plan. The API usage report doesn’t align with all of the other evidence I have and your UI counts against the API calls so my content is held hostage until next month. Now I’m in the position where my website is down and I can’t move somewhere else.
Can you please turn me back on for the month so I can pull my content off?
